How to Measure Social Media Success Beyond Likes


How do you really know if your social media is working? It’s not just about racking up likes and followers. True success is about tying your social media efforts directly to core business goals, like generating leads and driving sales.
The secret is to look beyond the surface-level numbers. We'll walk through a practical framework built on four key pillars—Awareness, Engagement, Conversion, and Advocacy—that will help you prove the real business impact of your work. This approach helps you stop chasing fleeting trends and start building a strategy driven by solid data.
Moving Past Vanity Metrics for Real Impact

It's so easy to get hooked on the dopamine rush of a rising follower count or a flurry of likes. We’ve all been there. But these numbers, often called vanity metrics, feel good but don't tell the full story. They prove people are seeing your content, but they don’t tell you if that visibility is actually turning into business.
The real challenge is proving the value of your social media in terms that the C-suite understands. According to the 2025 Sprout Social Index™, 65% of marketing leaders say they need to show how social media supports business goals to get leadership on board. This is where a strategic shift is crucial.
Why Actionable Metrics Matter More
When you focus on actionable metrics, you start to understand how your audience behaves and what that means for your bottom line. Instead of just counting likes, you start asking better questions. Did that viral Reel actually drive traffic to our product page? Did that fun poll on LinkedIn lead to new email sign-ups? These are the insights that build winning strategies.
This guide will help you build a framework that connects your day-to-day social media activities to tangible results. We'll break down four key pillars that give you a complete picture of your performance:
- Awareness: How many people are actually seeing your brand?
- Engagement: Who is interacting with your content, and what are they doing?
- Conversion: Are those interactions leading to the actions you want, like a purchase or a download?
- Advocacy: Are your followers turning into loyal brand champions who spread the word for you?
Focusing on these areas lets you build a powerful narrative that demonstrates clear ROI. You can go from saying, "Our post got 1,000 likes," to "Our campaign generated 50 qualified leads and contributed to a 15% increase in sales." See the difference?
This shift from vanity to value is what separates a novice from an expert social media manager. It's about connecting the dots between a share on Instagram and a sale on your website, proving that social media isn’t just a megaphone—it’s a powerful business driver.
Ultimately, getting past superficial metrics requires a solid grasp of how to measure marketing effectiveness and maximize ROI. When you adopt this mindset, you can fine-tune your content, optimize your ad spend, and confidently articulate the value you bring to the table. Let’s dive in and connect your business objectives to the social media KPIs that truly matter.
Connecting Business Goals to Social Media KPIs
Let’s get one thing straight: effective social media measurement doesn't start with your latest post. It starts with your core business objectives. So many marketers fall into the trap of chasing vanity metrics like likes and follower counts. The real goal is to draw a clear, undeniable line from a high-level business objective straight to the social media metrics you're tracking day in and day out.
Think of it as a strategic map. If your company's big push this quarter is to increase product trials, your mission on social media isn't just to "post more." It's to drive qualified traffic to your sign-up page. This simple shift in perspective completely changes how you build your content strategy and, more importantly, how you define success.
In that scenario, you’d stop obsessing over follower growth and start zeroing in on tangible Key Performance Indicators (KPIs). Your new dashboard would prioritize metrics like the click-through rate (CTR) on demo links in your posts and, crucially, the conversion rate of visitors who land on your site from your social channels.
Leading Versus Lagging Indicators
To get the full story, you need to understand the difference between two types of indicators. This distinction helps you see both what's happening right now and what it means for the future.
- Leading Indicators are the real-time metrics that act like early predictions of future success. Think of them as the pulse of your current efforts. A high share velocity (how fast a post gets shared) or a sudden spike in saves on an educational carousel post are great leading indicators. They signal you've hit on a topic that resonates, which is a strong predictor of future leads and conversions.
- Lagging Indicators are the backward-looking metrics that confirm long-term trends. These are the results your leadership team really cares about—things like quarterly sales figures attributed to social media or the overall customer lifetime value of social referrals.
By keeping an eye on both, you can make quick, data-informed tweaks to your strategy based on leading indicators while proving the long-term, bottom-line value with your lagging indicators.
This image shows how tracking specific engagement numbers is just the first step in a much larger process.
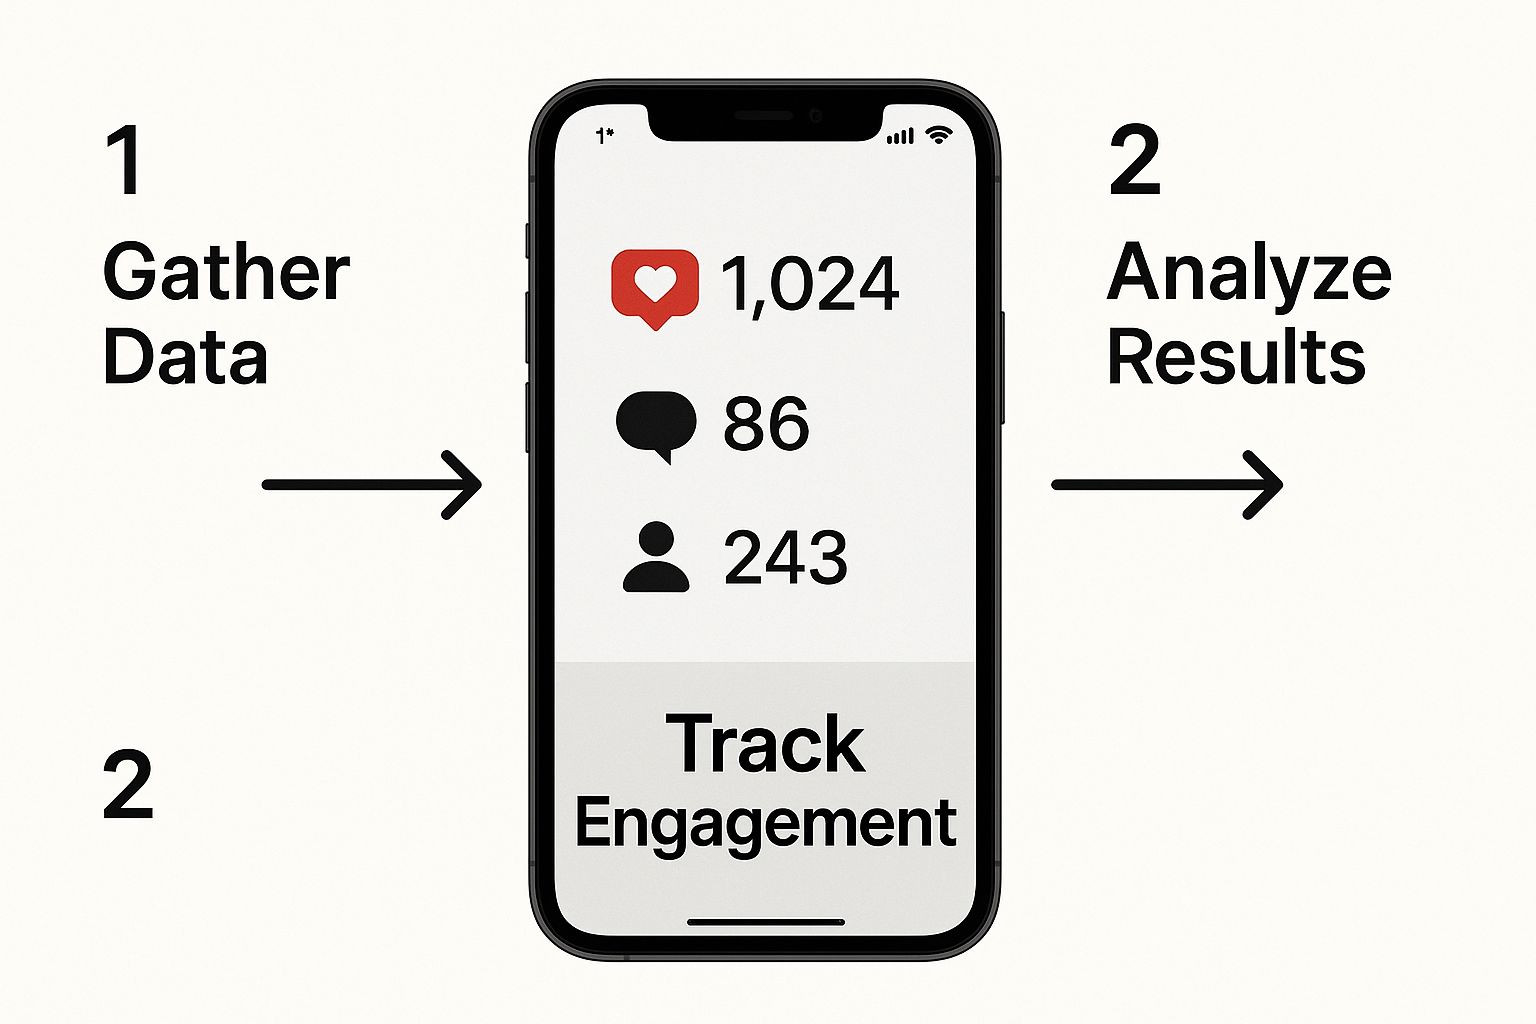
As you can see, engagement isn't just a number. It's a signal of audience interest that has to be connected back to your bigger business objectives to have any real meaning.
Applying the SMART Framework
To make your goals airtight and easy to track, the SMART framework is your best friend. It’s a classic for a reason. This method forces you to define your objectives with precision, taking all the guesswork out of your analysis and giving your team a clear target.
A vague goal like "increase engagement" is almost impossible to measure. But a SMART goal provides a precise roadmap: "Increase the average engagement rate on our LinkedIn video content by 15% over the next quarter by posting two educational tutorials per week."
Let's break that down:
- Specific: State exactly what you want to achieve. Don't just say "more website traffic." Get specific: "Increase referral traffic from Instagram Stories to our new product page."
- Measurable: Define the metrics you'll use. For the goal above, you’d track referral traffic in Google Analytics and link clicks in your Instagram Insights.
- Achievable: Be honest—is the goal realistic with your current resources? Aiming to double your follower count in a month is a tall order without a serious ad budget.
- Relevant: Does this social media goal actually support a broader business objective? Increasing Instagram traffic is only relevant if the business goal is to drive sales for a new product featured there.
- Time-bound: Give yourself a deadline. "By the end of Q3" creates a clear timeframe for evaluation and accountability.
By meticulously connecting your daily social media activities to tangible business outcomes, you can build a powerful https://www.yooz.ai/blog/b-2-b-social-media-strategy that stakeholders will actually understand and get behind. Nailing this foundational step is the key to proving the real-world value of your work.
Mastering the Metrics That Actually Matter
Alright, you’ve connected your social media goals to your big-picture business objectives. Now for the fun part: digging into the numbers that tell you what's really working. Forget vanity metrics like follower counts and simple likes. We're going to look at the data that tells a story about how people are finding you, interacting with you, and ultimately becoming customers.
This is how you stop guessing and start making strategic, data-driven decisions. Let's break down the metrics that truly move the needle.
How Many People Are You Actually Reaching? (Awareness)
Before anyone can buy from you, they have to know you exist. This first pillar is all about measuring your brand’s footprint in the digital world. Are you just shouting into the void, or is your message actually landing?
Here’s what to keep an eye on:
- Impressions: This is simply the total number of times your content was shown to someone. It’s a raw look at your potential visibility. Think of it as the number of cars that drove past your billboard—it doesn't mean they all looked, but it shows your potential audience size.
- Reach: This is where it gets more interesting. Reach is the number of unique people who saw your content. If one person sees your post five times, that’s five impressions but only one reach. Reach tells you how wide your net is being cast.
- Share of Voice (SOV): This one is a game-changer for understanding your place in the market. SOV measures how much of the conversation in your industry is about your brand versus your competitors. A high share of voice means you’re not just part of the conversation; you’re leading it.
When you see a spike in impressions followed by a similar rise in reach, you know your content is breaking out beyond your existing followers. That's the first sign your awareness strategy is hitting the mark.
Expert Tip: Don't just track reach on its own. Compare your reach to your follower count. If your reach is consistently higher, it means your content is being shared and discovered by new audiences—a huge win.
Is Anyone Actually Listening? (Engagement)
Engagement is the pulse of your community. It tells you if your content is truly connecting with people. And no, a "like" doesn't count for much these days—it's the most passive form of interaction you can get. We need to look deeper.
Focus on the actions that show someone is genuinely interested:
- Comments: A comment takes effort. It means your post was compelling enough to make someone stop, think, and type out a response. This is a direct line to what your audience is thinking.
- Shares: A share is the ultimate compliment. Someone is stamping your content with their personal seal of approval and broadcasting it to their own network. That's powerful, organic amplification.
- Saves: This might be the most underrated metric of all. A save means your content was so valuable or inspiring that someone wants to come back to it later. For a recipe, a how-to guide, or a workout routine, a high number of saves is a massive indicator of value.
Instead of just looking at individual numbers, calculate a more meaningful engagement rate. Add up your high-intent interactions (comments, shares, saves), divide by your total followers, and multiply by 100. This gives you a much clearer picture of how much your audience truly cares.
For any brand selling online, this is crucial. High engagement signals to the algorithms that your content is good, so they show it to more people. Consider this: for retail brands, Instagram's average engagement rate is 1.16%, absolutely dwarfing Facebook's 0.09%. With people spending an average of 2 hours and 21 minutes on social media every day, you need every post to count.
Are People Taking the Next Step? (Conversions)
This is where the rubber meets the road—where your social media activity starts to look like real business results. Conversions are all about tracking whether your followers are taking the specific action you want them to.
You'll need to get a little technical here, but it's worth it. Track these metrics:
- Website Clicks: How many people are actually leaving the social platform to visit your turf? This is the bridge between your social media presence and your website, blog, or landing page.
- Lead Magnet Downloads: If you're offering a free guide, webinar, or checklist, this is your metric. Tracking downloads that come directly from social media shows you exactly how effective your lead generation efforts are.
- Sales: The ultimate goal. By using UTM parameters—which are just little tracking codes you add to your links—you can see precisely which posts on which platforms are driving actual sales. This is how you prove your social media ROI without a shadow of a doubt.
Looking at these numbers will tell you which types of content and calls-to-action are actually convincing people to click, download, or buy.
Are You Building True Fans? (Advocacy)
The final pillar, advocacy, is about turning customers into a volunteer marketing army. An advocate doesn't just buy from you; they rave about you.
Here’s how you can measure this loyalty:
- Brand Mentions: Keep an eye on how often people mention your brand, especially when they don't tag your official handle. Untagged mentions are a sign of genuine, organic word-of-mouth.
- Customer Sentiment: Don't just count the mentions; understand the feeling behind them. Are people saying positive, negative, or neutral things? Sentiment analysis tools can paint a clear picture of your brand's reputation and how happy your customers really are.
When you nail all four of these pillars, you move beyond simply managing social media accounts. You start building a powerful, self-sustaining marketing engine fueled by real data and genuine community.
Choosing the Right Social Media Analytics Tools
Having the right data is only half the battle. Raw numbers are just noise until you have the right tools to translate them into actual intelligence. This is your guide to the platforms that turn confusing metrics into a clear roadmap for growth.
Picking a tool isn't about finding the one with the flashiest dashboard or the longest feature list. It’s about finding the right fit for your goals, your team, and your budget. Let's dig into how to make that choice, starting with the powerful tools you already have at your fingertips.
Start with Native Analytics Platforms
Every major social network has its own built-in analytics dashboard, and honestly, this is the best place to start. They’re free, easy to use, and give you valuable data straight from the source.
- Meta Business Suite: This is your command center for Facebook and Instagram. It gives you a combined view of key metrics like reach, engagement, and audience demographics. It’s fantastic for seeing what’s resonating with your followers on a post-by-post basis.
- TikTok Analytics: For anyone serious about video, this dashboard is a goldmine. You can track video views and follower growth, but the real gem is learning the exact times your audience is most active and scrolling.
- LinkedIn Analytics: Essential for B2B. This is where you get deep insights into your visitor demographics—think job titles, company sizes, and industries. It’s the perfect way to confirm you’re actually reaching the professionals you’re trying to target.
These native tools are perfect for daily check-ins and quick performance reviews. But they do have their limits. Each one exists in its own little world, so you're constantly jumping between tabs to piece together the full story. They also lack more advanced capabilities like tracking your competitors or digging into brand sentiment.
When to Upgrade to Third-Party Tools
Eventually, you'll probably hit a wall with what the native tools can offer. That’s when third-party platforms become a game-changer. These tools pull all your data from every channel into one unified dashboard, saving you a ton of time and uncovering cross-platform trends you’d completely miss otherwise.
It might be time to upgrade if you find yourself needing to:
- Manage multiple accounts efficiently: If you're juggling several brand profiles or a complex multi-channel strategy, native tools just won't cut it.
- Benchmark against competitors: You need to know where you stand. Platforms like Sprout Social let you track your share of voice against your main rivals, showing you exactly how much of the industry conversation you own.
- Conduct deep sentiment analysis: Want to know how people really feel about your brand? A tool like Hootsuite can analyze mentions and tag them as positive, negative, or neutral, giving you a real-time pulse on customer perception.
- Automate reporting: Manually pulling numbers into a spreadsheet every month is a soul-crushing task. Third-party tools can generate beautiful, presentation-ready reports automatically. Many can be enhanced with AI to help you create better content. For a closer look, explore these popular AI tools for content creation that many marketers are adopting.
The right tool transforms your workflow from reactive to proactive. Instead of just reporting on what happened last month, you gain the foresight to spot trends, anticipate what your audience wants next, and make smarter decisions that actually drive business results.
Connecting Social to Your Website with Google Analytics 4
Here’s where it all comes together. One of the most important things you can do is connect your social media efforts directly to your website’s performance, and Google Analytics 4 (GA4) is the tool for the job. This is how you prove that your social strategy is contributing to the bottom line—things like leads and sales.
The key is using UTM parameters. These are just little tracking codes you add to the end of your links, and they tell GA4 exactly where your website traffic is coming from. Inside GA4, you can then build reports to answer really specific questions.
For instance, you could create a custom report that shows you:
- How much traffic came from your latest Instagram campaign.
- The average time those visitors spent on your site.
- How many of them completed a key action, like signing up for your newsletter or buying a product.
This is how you demonstrate tangible ROI. It lets you walk into a meeting and say, "Our LinkedIn campaign drove 50 new leads with a conversion rate of 5%," instead of just, "Our post got a lot of clicks." That’s the kind of language that gets leadership’s attention and secures your budget for the next quarter.
Turning Social Media Data Into Reports That Actually Matter

Let's be honest: collecting metrics is the easy part. The real work begins when you have to turn that mountain of raw numbers into a story—a story that actually explains the why behind your performance. A good report doesn't just regurgitate data; it adds context, spots the important trends, and delivers clear insights that tell you exactly what to do next.
This is where you go from just managing social media to driving business strategy. It’s all about connecting your day-to-day activities to tangible business outcomes and presenting it all in a way that your boss or client will actually read and understand. So, let’s ditch the boring spreadsheets and talk about building reports that get attention.
Spotting Trends and Figuring Out What’s Working (and What Isn’t)
Your data is always trying to tell you something; you just have to learn its language. The secret is looking for patterns over time. A single post’s performance is just a blip on the radar, but tracking your metrics monthly or quarterly is what reveals the big picture.
Imagine you suddenly see a nosedive in engagement across all your accounts. Instead of hitting the panic button, it’s time to play detective. Did you recently change up your content style? Maybe a platform algorithm just got a major overhaul. By laying your performance data next to your content calendar and industry news, you can pinpoint the real cause and make a smart adjustment.
When you're digging into the numbers, keep an eye out for a few key things:
- Your "Greatest Hits": Look for the content formats or topics that consistently knock it out of the park. Are your behind-the-scenes videos getting way more love than your polished graphics? That's your cue to double down on what your audience wants.
- Performance Dips: Pinpoint the exact moments your metrics took a hit. Try to connect those dips with specific campaigns, external events, or even a day you forgot to post. Understanding the cause is the first step to preventing it from happening again.
- Shifts in Audience Behavior: Are people interacting differently? For instance, a big spike in saves and shares (even if likes are flat) is a great sign that your content is becoming a go-to resource for your audience.
How Do You Stack Up? Benchmarking Against the Competition
Tracking your own progress is critical, but it's only half the story. To truly understand your performance, you need context. Is your engagement rate a little low, or are you actually crushing it for your industry? Benchmarking gives you the answer by putting your numbers side-by-side with your key rivals.
Start by picking two or three direct competitors and keeping tabs on their public metrics, like follower growth and engagement on their posts. This isn't about copying them; it's about setting realistic goals and spotting opportunities. If a competitor is seeing huge success with a certain type of content, it might be worth exploring a similar approach—with your own unique brand spin, of course.
An effective report doesn’t just show your numbers; it places them within the broader market context. It answers the crucial question, "How are we doing compared to everyone else?" This perspective is what turns a simple performance update into a strategic business document.
It’s also crucial to understand the wider industry climate. For example, recent analysis from RivalIQ.com covering over 4 million posts revealed that engagement rates have declined across the board. They found engagement dropped on Facebook by 36%, Instagram by 16%, and TikTok by 34%. Knowing this kind of information helps you explain to stakeholders why your own numbers might be shifting, framing your performance realistically.
Crafting Reports That People Actually Want to Read
The final, crucial step is packaging all your brilliant analysis into a report that’s clear, concise, and compelling. Stakeholders are busy. You need to get straight to the point and communicate the value of your work quickly.
A killer report should always nail these key elements:
- The TL;DR (Executive Summary): Start with the highlights right at the top. What were the biggest wins? The most important lessons learned? Your key recommendations for next month? This gives a busy exec everything they need in a few seconds.
- Progress Against Your KPIs: Use visuals like charts and graphs to clearly show how you’re tracking against the specific goals you set out to achieve. Make the data easy to scan and digest.
- Insights and Analysis (The "So What?"): This is the heart of your report. Don’t just state the numbers; explain what they mean. For example, instead of "Engagement rate was up 10%," try "Our engagement rate jumped by 10% this month, driven primarily by the success of our new user-generated content campaign, which signals a strong audience appetite for more authentic content."
- Clear Next Steps: Always end with a plan. Based on everything you just analyzed, what are you going to do next month or next quarter to build on your wins and tackle your challenges?
By structuring your reports this way, you do more than just justify your social media budget. You position yourself as a strategic partner who knows how to connect social media performance to real, measurable business growth.
Turning Your Performance Data into Action
https://www.youtube.com/embed/NwZy0evRnZs
So, you've gathered all this data. What now? Collecting numbers is just the starting line. The real wins come from turning those insights into smarter decisions that actually move the needle for your business.
This is where your analysis fuels your strategy. It’s all about creating a constant feedback loop: measure what you're doing, figure out what the results mean, tweak your approach, and then do it all over again. Instead of being locked into a rigid plan, you stay flexible, adapting based on what your audience shows you they love (and what they ignore).
Test, Tweak, and Refine Your Content
The only way to truly know what resonates is to test it. Think of yourself as a scientist in a lab, running small experiments to find that magic formula for your audience.
A great way to start is with A/B testing. This just means comparing two versions of a post to see which one performs better. You can test almost anything:
- Headlines & Captions: Try a straightforward, benefit-driven caption against one that asks a provocative question.
- Visuals: Does a custom-designed graphic outperform a candid, behind-the-scenes photo? There's only one way to find out.
- Calls-to-Action (CTAs): Pit a soft CTA like "Learn More" against a more direct one like "Shop Now" and see which drives more clicks.
The key is to change only one thing at a time. If you change both the image and the caption, you won't know which element made the difference. These small, consistent tweaks really add up over time.
Expert Tip: Likes are nice, but don't get hung up on them. Pay close attention to posts that get high numbers of shares and saves. These are the true indicators of value. When someone saves your post, they're bookmarking it for later. When they share it, they're vouching for you. That’s gold.
Optimize Your Big-Picture Strategy
Your test results shouldn't just live in a spreadsheet; they should directly shape your entire content plan. Be ready to pivot—double down on what's working and ruthlessly cut what isn't.
For instance, if you discover that running polls or asking questions drives a massive spike in comments, make interactive content a regular part of your schedule. On the flip side, if those text-only updates on LinkedIn are getting zero traction, it’s a clear signal to shift that effort into something that performs better, like case studies or short videos.
Your engagement rate is still one of the most important metrics to measure social media success. It’s a direct reflection of how much people are interacting with your content. According to data from over 125 million posts analyzed by Socialinsider.io, the average engagement rate is about 0.15%. This is a crucial number because high engagement tells the platform's algorithm that your content is valuable, which often leads to more visibility.
You can also use your audience data to get way more specific with your targeting. If your analytics reveal that your content is a huge hit with 25-34 year-olds in a particular city, start creating content that speaks directly to their local interests. For even more ways to connect with your audience, take a look at our guide on how to increase social media engagement.
Got Questions About Measuring Success? Let's Unpack Them
Even with the best plan in place, figuring out how to measure social media success can bring up some tricky questions. It happens to everyone. Let's walk through a few of the most common ones I hear from clients to help you sharpen your own reporting process.
How Often Should I Actually Be Reporting on My Social Media Metrics?
This is a big one, and the answer isn't "as often as possible." The key is to match the reporting frequency to the audience. I always recommend a tiered approach.
- Weekly Check-ins: These are for you and your immediate team. Think of them as quick, tactical huddles. Are we on track? Do we need to adjust anything this week? Keep it simple.
- Monthly Reviews: This is where you zoom out a bit. It’s the perfect cadence for tracking progress against your bigger goals and showing your manager what's working.
- Quarterly Reports: Save these for leadership. This is your chance to connect social media activity to the bottom line, demonstrate strategic impact, and talk about long-term ROI.
What’s a "Good" Engagement Rate, Anyway?
Ah, the million-dollar question. The honest answer? There's no single magic number. Chasing some universal benchmark is a recipe for frustration because a "good" rate is incredibly contextual. It really depends on your industry, the specific platform, and even your audience size.
For instance, a 2% engagement rate might be fantastic for a large B2B tech company on LinkedIn, but it could be seen as low for a small, niche fashion brand on Instagram with a hyper-engaged community.
Instead of getting hung up on global averages, focus on your own progress. Aim to improve your engagement rate month-over-month. And if you need a benchmark, look at your direct competitors. That’s where you’ll find the most relevant and actionable insights.
How Do I Measure ROI for a Brand Awareness Campaign?
This is a classic marketing puzzle. Awareness campaigns are top-of-funnel, so drawing a straight line to revenue is tough. But it's not impossible. You just have to track the right "proxy" metrics—the breadcrumbs that show your efforts are building brand health and paving the way for future sales.
So, what should you look for? I always tell people to check for a noticeable lift in branded search traffic in their Google Analytics. Are more people searching for your company name directly? That’s a great sign.
Also, keep an eye on direct website visits (people typing your URL right into their browser) and your share of voice, which is just your brand's mentions compared to your competitors. A steady increase in these areas is solid proof that your awareness efforts are moving the needle.
Ready to create engaging LinkedIn posts that drive real results? Let Yooz AI help you generate stunning content, schedule it perfectly, and go viral. Start creating with Yooz AI today!